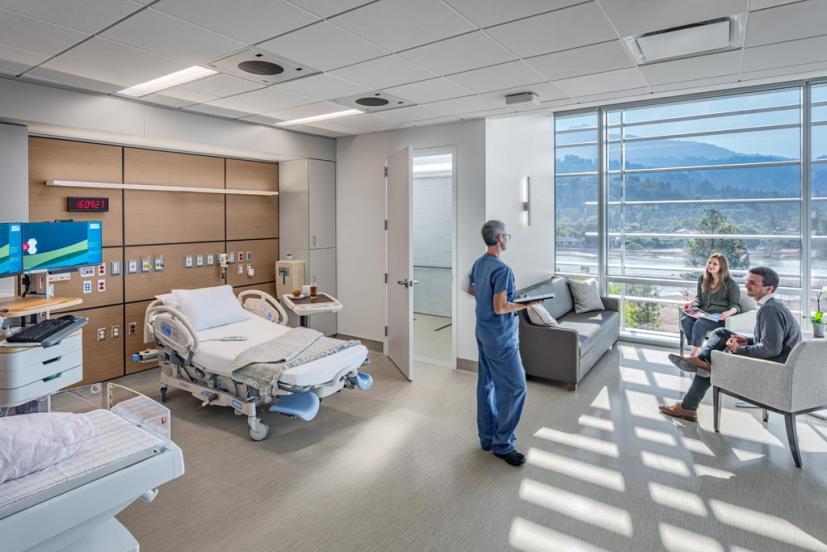
One of the most consequential decisions you'll make in your pregnancy happens before you're even in labor: which hospital you choose to give birth in. Two hospitals ten minutes apart can have wildly different cultures around cesarean rates, VBAC support, and midwifery-led care, and most parents never see those differences until they're already in a gown.
I put together this report so my clients can compare Bay Area hospitals side by side, and I check it every quarter, using publicly reported data from the California Maternal Quality Care Collaborative (CMQCC), published through Cal Hospital Compare. The current numbers cover calendar year 2025, the most recent full year available.
This isn't a ranking. It's context. The "best" hospital for you depends on your risk profile, your provider, your insurance, and what you want your birth to feel like. But if an unmedicated, natural birth is your goal, the first number most families look at is the c-section rate, so that's where we'll start.
Lowest C-Section Rates at a Glance
The measure used here is the NTSV cesarean rate: the c-section rate among first-time mothers carrying a single, head-down baby at full term. Lower is better. The California average this year is 24.9%, and the state target is 23.6% or lower. Nine of the 15 hospitals in this report came in at or under that target, listed here from lowest to highest (Kaiser Permanente San Francisco and UCSF are tied at 22.6%):
- Kaiser Permanente San Leandro: 18.5% (Superior)
- Kaiser Permanente Redwood City: 19.1% (Superior)
- El Camino Hospital, Los Gatos: 20.5% (Above Average)
- John Muir Medical Center, Walnut Creek: 21.8% (Above Average)
- MarinHealth Medical Center: 21.9% (Average)
- Alta Bates Summit, Alta Bates Campus: 22.2% (Average)
- Kaiser Permanente San Francisco: 22.6% (Average)
- UCSF Betty Irene Moore Women's Hospital: 22.6% (Average)
- Kaiser Permanente Oakland: 23.6% (Average)
The Kaiser Permanente hospitals are open to Kaiser members. If you're not a Kaiser member, the lowest rates among the other hospitals are El Camino Hospital, Los Gatos (20.5%), John Muir Medical Center, Walnut Creek (21.8%), MarinHealth Medical Center (21.9%), Alta Bates Summit, Alta Bates Campus (22.2%), and UCSF Betty Irene Moore Women's Hospital (22.6%).
A low hospital-wide rate is encouraging, but it isn't a promise about your own birth. These figures blend every practice that delivers at a hospital, so please read the note on hospital numbers versus your provider's numbers below the tables.
What the Numbers Actually Mean
- NTSV Cesarean Rate: the c-section rate among first-time mothers carrying a single, head-down baby at full term. This is the standard measure for comparing hospitals, since it looks at a similar group of births everywhere. Lower is better.
- VBAC Rate: how often people who've had a prior cesarean go on to have a vaginal birth at that hospital. A higher rate can be a sign that VBAC is actively supported there. Ask your own provider about their approach.
- Episiotomy Rate: how often a surgical cut is made to the vaginal opening during birth. Lower is better on this measure, as hospitals generally aim to do fewer episiotomies.
- CNM-Attended Deliveries: the percentage of births attended by a Certified Nurse-Midwife. It shows how much midwifery care happens at that hospital, though it doesn't tell you whether a midwife practice is open to you.
- Baby-Friendly Designation: a hospital designation based on WHO/UNICEF standards for supporting breastfeeding and early bonding.
Cal Hospital Compare also labels each hospital on each measure by comparing it with other hospitals. Superior means well above average compared with other hospitals, Above Average means better than average, Average means within the average range, and Below Average means worse than average. These labels take the number of births at each hospital into account, so a hospital's label and its raw percentage don't always line up neatly. The c-section column below shows the label for every hospital, and the other columns show a label only where a hospital earned Superior.
Kaiser Permanente Hospitals
If you're a Kaiser Permanente member, your hospital options are set by your plan, so these are grouped separately from the rest of the Bay Area comparison below. Both tables are sorted from the lowest c-section rate to the highest.
| Hospital | NTSV C-Section (lower is better) | Episiotomy | VBAC Rate | CNM-Attended | Baby-Friendly |
|---|---|---|---|---|---|
| Kaiser Permanente San Leandro | 18.5% (Superior) | 0.7% | 30.6% | 51.5% | No |
| Kaiser Permanente Redwood City | 19.1% (Superior) | 0.9% | 37.1% (Superior) | 62.2% | No |
| Kaiser Permanente San Francisco | 22.6% (Average) | 0.9% | 27.8% | 0% | No |
| Kaiser Permanente Oakland | 23.6% (Average) | 0.5% | 26.4% | 45.3% | No |
| Kaiser Permanente Santa Rosa | 25.1% (Average) | 0.4% | 26.7% | 48.2% | No |
| Kaiser Permanente Walnut Creek | 25.2% (Average) | 0.7% | 26.9% | 49.5% | No |
| California State Average | 24.9% | 2.3% | 19.4% | 14% | Not applicable |
2026 Bay Area Comparison
| Hospital | NTSV C-Section (lower is better) | Episiotomy | VBAC Rate | CNM-Attended | Baby-Friendly |
|---|---|---|---|---|---|
| El Camino Hospital, Los Gatos | 20.5% (Above Average) | 3.5% | 24.0% | 31.5% | Yes |
| John Muir Medical Center, Walnut Creek | 21.8% (Above Average) | 1.9% | 18.5% | 13.3% | Yes |
| MarinHealth Medical Center | 21.9% (Average) | 0.8% | 35.7% (Superior) | 46.9% | Yes |
| Alta Bates Summit, Alta Bates Campus | 22.2% (Average) | 0.7% | 37.2% (Superior) | 44.3% | No |
| UCSF Betty Irene Moore Women's Hospital | 22.6% (Average) | 1% | 30.6% | 22% | Yes |
| Zuckerberg San Francisco General | 24.4% (Average) | 0.5% | 41.4% (Superior) | 44.1% | Yes |
| CPMC, Van Ness Campus | 24.5% (Average) | 2.9% | 18.2% | 12.5% | Yes |
| Lucile Packard Children's Hospital, Stanford | 27.9% (Below Average) | 0.8% | 16.3% | 0.7% | Yes |
| El Camino Hospital, Mountain View | 28.0% (Below Average) | 2.6% | 10.8% | 0% | No |
| California State Average | 24.9% | 2.3% | 19.4% | 14% | Not applicable |
Source: Cal Hospital Compare / CMQCC Maternal Data Center, calendar year 2025 (01/01/2025 to 12/31/2025), viewed August to October 2026. Cal Hospital Compare notes that its information is for informational use only, so please confirm details directly with your hospital and provider, as policies and staffing can change.
Hospital Numbers vs. Your Provider's Numbers
Everything above is a hospital-wide figure. It blends every practice and provider that delivers at that hospital, so it can't tell you what your own odds look like. Hospitals also organize their care differently. At some, midwives and OBs work together as one combined team, and at others they practice separately, and the numbers for each group can look quite different. UCSF, for example, describes its physicians and certified nurse-midwives as working side by side as one team. Because of this, a hospital's overall c-section rate can reflect how its practices are organized as much as how any one provider practices.
Before you choose, ask your provider or practice for their own c-section rate for first-time, low-risk births, and confirm exactly which hospital and campus you would deliver at.
North Bay
MarinHealth Medical Center has a 21.9% NTSV c-section rate, below the state average of 24.9%, along with a Superior VBAC rate (35.7%), a CNM-attended delivery rate of 46.9% (more than three times the state average), and Baby-Friendly designation.
Kaiser Permanente Santa Rosa has a 25.1% c-section rate, close to the state average, with an Above Average VBAC rating and a CNM-attended delivery rate of 48.2%.
Peninsula / South Bay
Kaiser Permanente Redwood City has the second-lowest c-section rate in this report (19.1%, Superior), a Superior VBAC rate (37.1%), and the highest CNM-attended delivery rate on the list (62.2%, more than four times the state average).
El Camino Hospital, Los Gatos has the lowest c-section rate among the non-Kaiser hospitals (20.5%, Above Average), and it's on the Maternity Care Honor Roll. Its episiotomy rate (3.5%) is higher than the state average (2.3%). Its Mountain View campus, despite sharing a health system, shows a different profile: a 28.0% c-section rate (Below Average) and a 10.8% VBAC rate. If you're considering El Camino, ask which campus your provider delivers at.
Lucile Packard Children's Hospital, Stanford has a 27.9% c-section rate (Below Average) and a CNM-attended delivery rate of 0.7%. As a specialty children's and referral hospital, its patient mix can differ from a typical community hospital's, so ask your provider how these figures apply to you.
San Francisco
Kaiser Permanente San Francisco has a 22.6% c-section rate, under the state target. Its CNM-attended rate is reported as 0%, so it's worth asking directly about midwifery availability there.
UCSF Betty Irene Moore Women's Hospital at Mission Bay also has a 22.6% c-section rate, under the state target, with an Above Average VBAC rating (30.6%), a CNM-attended delivery rate of 22%, and Baby-Friendly designation.
Zuckerberg San Francisco General has a 24.4% c-section rate, close to the state average, with the highest VBAC rate on this list (41.4%, Superior), a CNM-attended delivery rate of 44.1%, and Baby-Friendly designation.
CPMC, Van Ness Campus has a 24.5% c-section rate and sits near the state average on most measures.
East Bay
Kaiser Permanente San Leandro has the lowest c-section rate in this report (18.5%, Superior), with a 30.6% VBAC rate and a 51.5% CNM-attended delivery rate.
Alta Bates Summit (Alta Bates Campus) has a 22.2% c-section rate, a Superior VBAC rate (37.2%), and a CNM-attended delivery rate of 44.3%.
John Muir Medical Center, Walnut Creek has a 21.8% c-section rate (Above Average) and Baby-Friendly designation, though its CNM-attended (13.3%) and VBAC (18.5%) rates run closer to the state average.
Kaiser Permanente Oakland has a 23.6% c-section rate, right at the state target, and a 45.3% CNM-attended delivery rate. Kaiser Permanente Walnut Creek has a 25.2% c-section rate and a 49.5% CNM-attended delivery rate.
A Note on This Report
I check these numbers every quarter and update this report whenever the published figures change, so you're always looking at recent data rather than a live feed that could be out of date. The figures above were last checked in October 2026.
These numbers are a starting point for a conversation, with your OB, your midwife, and with me, not a substitute for one. This report is for educational purposes only and isn't medical advice. If you'd like help thinking through what these numbers mean for your specific pregnancy and birth goals, let's talk.